
On Thursday, April 27, 2023, from 3:00-4:30 PM, an audience gathered via Zoom and in person at the Richter Library 3rd floor conference room to hear the 2022-2023 IDSC Fellows give their final research project presentations. A Biomedical Engineering student (Jeffery Serville), Civil Engineering student (Sadegh Tale Masoule), and two Marine Science students (one graduate—Kelly Soluri and one undergraduate—Shara Sookhoo) thanked their mentors, supporters, and collaborating researchers. We invite you to watch the full session on YouTube. Here are some takeaways:
To skip ahead: Jeffrey begins at 1:40, Kelly at 10:12, Shara at 25:00, and Sadegh at 40:20. Q+A begins at 55:40.
Jeffrey Serville

Orientation-selective Deep Brain Stimulation of Midbrain Circuits in the Yucatan Micropig for Improving Gait After Spinal Cord Injury
2nd year PhD student in the Department of Biomedical Engineering, College of Engineering
Over the course of the spring 2023 semester, IDSC Fellow Jeffrey Serville worked with IDSC Advanced Computing Director Ravi Vadapalli to utilize the U’s supercomputers to remedy a major computational bottleneck in his research on the stimulation of the mesencephalic locomotor region (MLR) of the brain.
Known to produce walking when stimulated, MLR stimulation is a current therapy to freeze gait in Parkinson’s Disease patients. However, Jeffrey’s project, “Orientation-selective Deep Brain Stimulation of Midbrain Circuits in the Yucatan Micropig for Improving Gait After Spinal Cord Injury,” used MLR stimulation to improve walking after incomplete spinal cord injury using pigs as translational large animal model for manual treadmill experiments. Although the the anatomical correlates of the MLR are controversial, Jeffrey’s project explains the mixed results though MLR DBS interventions.
Using an MRtrix environment on the U’s Pegagus supercomputer cluster, Jeffrey was able to reduce the preprocessing time of DWIs (diffusion-weighted images) from 16 hours to 1-1.5 hours.
Kelly Soluri
 Forecasting Bycatch Hotspots using Multivariate Random Forest Machine Learning
M.S. Candidate for Marine Biology and Ecology, Rosenstiel School for Marine, Atmospheric, and Earth Science
In order to find better fishing spots and to mitigate bycatch (a term for untargeted individuals that are caught by commercial fisheries), IDSC Fellow Kelly Soluri’s project entitled “Forecasting Bycatch Hotspots using Multivariate Random Forest Machine Learning” used the NOAA Gulf of Mexico Observer Bottom Longline Survey data (2006-2021) offering 626,641 observations of total bycatch and the NOAA Gulf of Mexico Data Atlas for environmental data imputed by proximity using the MICE (multivariate imputation by chained equations package) in RStudio. Tweaking the environmental and variables, the data set was reduced to 11,000 sets (focusing on 30 species). To test the random forest algorithm compared to three other machine learning algorithms: support vector machine, boosted regression tree, and neural network, Kelly picked 3 species (Red Snapper—abundant, targeted, bycatch species, Night Shark—abundant, untargeted, protected, and Loggerhead Sea Turtle—rare, untargeted, and extremely protected species) and did 75% training and 25% testing looking at “What is the predicted catch per unit effort (CPUE) of multispecies bycatch?” The three types of informational diagnostics used to indicate accuracy were RMSE, R Squared, and MSE, which revealed that, overall, a random forest algorithm was best predictive model.
The strongest predictors turned out to be environmental-based (such as depth, nitrate, and dissolved oxygen) and the species-associated predictors were similar in environmental niche with possible predator/prey dynamics. In conclusion, limitations to her research were other confounding factors not considered yet, like oceanographic data such as currents, wave heights, etc. And in addressing the issue of low data on rare species, Kelly is considering the possibility of grouping other rare species under an umbrella to make a more substantial data set. Her next steps include creating a geospatial map by latitude and longitude so they can compare the Gulf of Mexico to other regions.
Shara Sookhoo
Co-Occurrence Patterns in the Microbiomes of Six Species of Coral
Junior, Majoring in Marine Biology and Ecology, Rosenstiel School of Marine, Atmospheric, and Earth Science (Minors in Computer Science and Biochemistry and Molecular Biology)
Combining her Marine Science and Biology, Shara’s project “Co-Occurrence Patterns in the Microbiomes of Six Species of Coral” is addressing the resilience of coral reefs. While coral reefs comprise only 0.5% of the ocean seafloor, they contribute 25% of marine diversity, making them biological hotspots. It is predicted that by 2050, 90% of coral cover will disappear, but corals are resilient, and humans are helping to restore devastated coral reefs by out-planting more resilient strains.
 The first step in helping restore coral reefs is to look at what makes the coral resilient and what causes diseases in coral, but the challenge is that corals are very complex. As a holobiont, coral is an assemblage of a host and the many other species living in or around it, which, together, form a discrete ecological unit. Shara wants to study the microbiome community of the host, viruses, archaea, fungi, bacteria, and zooxanthellae. Recent research has shown that bacteria in corals can be beneficial, conferring resiliency to bleaching, disease, and enabling nutrient loading, but bacteria can also be pathogenic and has been proven to cause disease. This recent research looked at changes in the compositional aspect of the coral microbiome in response to environmental factors and disease but did not address the interactions of the bacteria in this community. The gap is what Shara decided to investigate: the co-occurrence patterns in the coral microbiome.
In assembling her data, Shara considered what are the key bacterial species and groups, and whether these are different for different coral species. Her research included samples gathered 2021 versus 2022 where the water changed from fresh water with synthetic salt, to fresh ocean water being pumped into the tanks. Shara wanted to look at whether the key bacterial species would change in response to the change in the water source. Her data set included samples gathered 30 samples each from 6 species of coral (Staghorn, Elkhorn, Boulder Star, Great Star, Mountainous Star, Grooved Brain) in 2021, and 10 samples each were gathered from 4 species of coral in 2022. Because bacteria is extremely hard to culture, Shara took a genetic approach to identify and quantify the bacteria.
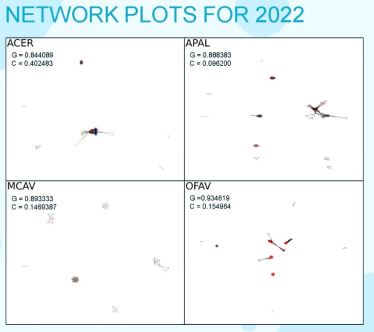
In comparing 2021 to 2022, the data revealed that not only was the dominant bacteria different in each of the 6 corals, but the dominant taxa changed completely from 2021 to 2022. To clean up her data: Shara removed the mitochondrial and chloroplast taxa (function known/irrelevant); to balance 2021 and 2022 she subset the taxa with more than 10 reads in at least 3 samples per species; and to compare sample to sample, she standardized the data using centered-log ratio. To reveal relationships between bacterial species, Shara used the Spearman correlation to find the number of co-occurrences between taxa and accepted correlations as valid only if it had an absolute value greater than 0.8 and a p value of less than 0.05. What was interesting about her co-occurrences, Shara explained, was that there were no significant negative correlations in 2021 samples. Thinking it was an error, they did it again with different packages and got the same result. The conclusion was that there was no competition in this data set (as a side note, Shara remarked that looking at the water source samples that year to see if the pattern was also present in the water sample). When comparing the years, resulting network plots show the variety of bacterial families (by color), their relationships (connecting lines), and by abundance (node size), there are more tightly knit clusters and more separation between them. 2021 showed no clustering by family. 2022 clustered by family showing more tightly knit clusters with a strong separation between them.

To look at the groups that she thought would be important, Shara clustered using greedy modularity maximization to find the community partition with the largest modularity. Having found those groups, she wanted to know: Are they functionally significant? In the 2021 data, Shara found that the members of these groups belonged to different families, but it’s still possible they have similar processes, the functions could be species specific. In the 2022 data, the members belonged to the same families, which might mean they have a dissimilar function, but it may just mean they ‘like to hang out together because they have a similar taxonomic lineage.

The number of clusters with five or more members were: ACER, APAL, MCAV, and OFAV. The ACER clusters for 2021 were Sulfur Cycling (species from different families that all play a role in sulfur cycling—so maybe they do have some kind of functional significance), Helicobacteraceae, and Possibly Pathogenic (only a few of known pathogenic bacteria were in this cluster, but the other bacteria that interact with the pathogenic bacteria could be studied to see how the other bacteria react to environmental cues, which could possibly affect the pathogenic bacteria and could up-regulate and down-regulate their abundance, and therefore their virulence, in the coral). Because it’s very hard to culture the bacteria, it’s very hard to figure out what their functions are, so by figuring out what cluster they are in, Shara said, we can classify their functions using this method.
In analyzing PageRank in the nodes using a version of Eigenvector, Shara looked at the hierarchy of the network. Finding the twenty highest-scoring nodes, Shara compared them across species, which revealed that there was no significant overlap over species. Comparing across years revealed that the change in water triggered an overhaul of the microbiomes, reflected in the compositional data.
Finally, Shara compared utilizing the PageRank analysis with another technique, Prevalent taxa method to identify the key species. While the Prevalent method was very easy to use, Shara noted, using only a single line of code out of the package, and it ran very quickly. Compared to the PageRank analysis where you must first run the co-occurrences (which takes a long time), build your networks, and then you need to get the nodes and do your PageRank analysis on it. However, the PageRank analysis was more sensitive in picking up the key bacterial species. Shara concluded you cannot use the Prevalence as a proxy because there was no overlap in key bacteria involved in structing the microbiome. Her key takeaways were that her networks were both specific to the coral species and the environment. The answer to her original question of what the key bacterial species and groups are, and what might their functions be, she saw that the clusters seem to have a common function and they are involved in the same, or similar, processes. Also, she found out the most important nodes varied across species and change in response in a change in the water source.
For future studies or in hindsight, Shara would like to make the datasets more comparable. Since the BLAST search taxa are not annotated down to the species level, she’d like to do more research to find out the functions of the bacteria. She’s also like to do that for the Top 20 PageRank to see if there’s an overlap in function of the PageRank taxa. For further analysis on the pathogenic groups, Shara stated, it would be interesting to see how the interactions in those groups change in response to environmental factors and see if those changes lead to an increase in the virulence of the pathogens. Lastly, she would like to look at different techniques (beyond the Spearman correlation) to build networks and see if there’s a perfect network, one that these keep algorithms coming back to identify what is the best technique to use when working with coral-associated bacteria.
Sadegh Tale Masoule
Segmentation and Evaluation of Micro-Cracks from Micro-CT Images of Concrete Elements
2nd year PhD student, Structural Materials Lab, College of Engineering
 In his final presentation on “Segmentation and Evaluation of Micro-Cracks from Micro-CT Images of Concrete Elements” Sadegh assessed the level of damage in concrete samples. He segmented the micro cracks (in the range of 10-50 micrometers) found with Micro-CT scanning. Then, with theoretical formulas, he tried to evaluate the metric of the damage in the system. Sadegh took a photograph and produced a segmented mask from the scan. Using those masks, he was able to construct a 3D model and evaluate the sample.
Sadegh’s project was divided into two phases: First, collecting a data set to be used for training; and second, constructing his own use-case-specific data set, transferring what he learned from the first phase and fine tuning and evaluating the performance of the model.
The data set collection from Phase 1 contained approximately 12,000 images and masks. The data was divided into 75% training, 15% evaluation, and 10% testing. For the initial training, he used an encoder-decoder approach to segmentation, which breaks down and then tries to reconstruct an image. The segmentation architectures he tried were Unet, Linknet, and Feature Pyramid Network. For the Convolutional Layers he used 8-10 different CNN architectures, including VGG19, Resnet, Efficient Net, InceptionV3, and SE-ResNeXt. The parameters Sadegh played with were: Segmentation Architecture, CNN model type, CNN model depth, Weight Initialization, Dropout, and other Hyperparameters. Also, the dataset was augmented to give it more variety. For example: Shifting, flipping, and rotating; elastic transforms; Gaussian noise; changing brightness, sharpness, contrast, saturation, etc.; and blurring and cropping. Blurring and elastic transforms were especially important because it blurs the threshold between the crack and the background, which helps the model to distinguish where the boundaries are. Next, Sadegh reviewed some of the experiments performed to see which model performed incrementally better. I
In the second phase, Sadegh began building a custom dataset by creating 17 cast concrete samples that were stressed to create microcracks (can take up to a month). Micro-CT scans of these samples render a 3D matrix of 8-bit elements where the depth can render 500-700 images. When multiplied by 17, that can give you a large dataset, but, because the samples would be very similar, Sadegh is using only 20-30 layers from each sample. He plans to create a total of 40 samples but times 20-30 would be a good size dataset.
As with medical imaging, Sadegh is utilizing transfer learning and is at the stage of domain adjustment. He plans to freeze the low-level information layers, and fine tune only the high-information layers. Once his custom dataset is ready , Sadegh plans to evaluate the transferred model on the test set of the new dataset, quantify the crack properties, and then he’ll be able to evaluate the extent of the damage in the sample based on the cracks. He will also be able to use these masks and convert them back into a 3D model.

Special thanks to the IDSC Fellows Steering Committee:
CHAIR | Mohamed Iskandarani
MEMBERS | Alberto Cairo, Kim Grinfeder, Daniel Messinger, Mitsunori Ogihara, Kamal Premaratne, Azizi Seixas, Ravi Vadapalli


